
InfiniEdge AI and AIOps: Establishing a Foundation for Intelligent Edge Operations
- Authors: Andreas Spanner
- Contributor: Ivan Necas
The mission of InfiniEdge AI is to bring advanced AI capabilities to the edge and distributed environments. The AIOps initiative focuses on the application of AI to operate these environments.
In today’s world, IT environments are exploding in complexity. We’ve moved from simple, monolithic applications to a sprawling landscape of microservices, containers, multi/hybrid cloud infrastructure and globally distributed edge environments. Growing distributed environments usually have a wide variety of different CPU and accelerator architectures. The sheer volume of data—logs, metrics, and traces—generated every second is far beyond what any human team can manually track.
When something goes wrong, finding the root cause can feel like searching for a needle in a digital haystack. Teams are drowning in alerts, leading to burnout and slow response times.
This is the problem that AIOps (Artificial Intelligence for IT/OT Operations) was born to solve. AIOps is a fundamental shift in how we manage technology. It uses data and machine learning to adapt in order to automate and enhance operations, allowing teams to move faster and from being reactive firefighters to proactive problem-solvers. This requires the use of Artificial Intelligence and Machine Learning (AI/ML) for the collection, analysis, and interpretation of telemetry data (metrics, logs, and traces) to enable deeper insights, automation of complex tasks, and a proactive and intelligent response to system behavior.
This article covers the fundamental concepts of AIOps.
AIOps and the Linux Foundation: Workstream 8 under the LF Edge organisation via the InfiniEdge AI project is dedicated to AIOps.
The AIOps User Experience
The target user experience (UX) from a human’s perspective differs from the standard today.
The AIOps system needs to autonomously:
- Enable natural language interactions
- Learn and understand what normal looks like, ongoingly
- Distinguish signals over noise
- Deduct and detect anomalies
- Correlate data points
- Predict future incidents
- Analyse root causes (RCA)
- Suggest and create remediation steps
In order to create such a UX we need several building blocks or capabilities. The AIOps capabilities are categorised as Observe, Engage, and Act.
- Observe is about data ingestion of large, low to high velocity streams of heterogeneous data: metrics, logs, traces, and events from across potentially vast IT and OT landscapes including topology and dependency information such as source code, documentation, configuration settings, architecture diagrams, incident reports, FAQ documents and more
- Engage is about analysing and processing this data to find patterns and filter out the signals from the noise and perceive failures through
- Event correlation
- Anomaly detection, and
- Root cause analysis (RCA)
- Act is about actioning the insights generated in the Engage phase and turning it into remediation ranging from assisted questioning, opening an ITSM ticket, through mitigation solution generation, script generation to automatic execution.
On top of that we need to evaluate the AIOps solution as a whole and the parts thereof on an ongoing basis. The two parts therefore are:
- Holistic evaluation assesses AIOps’ impact on business-critical lagging indicators via the MTTx metrics family: Mean Time to Resolution (MTTR), Mean time to Detect (MTTD), Mean Time between failures (MTBF). We can extend this into operational KPIs such as Alert Noise Reduction and Manual VS Automated resolutions. The aim is to measure the AIOps’ financial and operational ROI.
- Component level evaluation assesses the components efficacy of the AIOps solution. The benchmarking of these leading indicators still drives the aforementioned ROI, but are focussed on component level metrics like the
- F1 score for anomaly detection
- Event correlation and event clustering
- Precision of the root cause analysis (RCA)
- Correctness, safety and reliability of automated remediation approaches
A typical component diagram between these AIOps capabilities is depicted below.
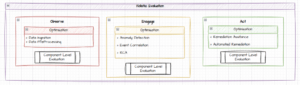
Figure1: AIOps capabilities, categories and evaluation
Let’s now look a bit deeper into these capabilities separately.
From Data to Remediation
Telemetry data includes logs, metrics and traces. Additionally data can come in different forms like screen shots, images, architecture diagrams, documentation, log files, or files containing traces and metrics.
With the constant evaluation of AI, finding the best combination of AIOps solution components is a recurring and ongoing task. Each combination and permutation of model, model size, model architecture, tuning, prompts, tooling and retrieval augmentation performs differently. With new approaches and research becoming available nearly on a daily basis an evaluation and test harness is super critical.
To make the test results comparable across permutations and test runs it is recommended to use the same data sets and the same metrics framework.
Scope
The scope of AIOps solutions can be fairly wide, covering
- Information Security including intrusion detection
- Applications and middleware
- Network
- Operating System
- Infrastructure
- Data repositories
Paired with the relevant lifecycle stages such as
- Initial Deployment, updates and configuration changes
- Day2Ops type monitoring, including
- Fault diagnosis
- Log analysis
- Backup and recovery
- Performance optimization
- Decommissioning
Datasets
In order to test and validate AIOps solutions we require a variety of comprehensive data sets. Especially if we aim to make the AIOps solution adaptable to specific environments across the different domains mentioned above. We need to hence build, train, test and validate accordingly.
Common data sets referred to by the AIOps research community on arxiv.org are
- Hadoop Distributed File System (HDFS)
Generated at the Lawrence Livermore National Labs, containing over 11 million log messages from a large computing cluster - Thunderbird
Several months worth of Thunderbird supercomputer logs from the Sandia National Labs, containing millions of log messages from a high-performance computing system. - BGL (Blue Gene/L)
A log dataset from the Blue Gene/L supercomputer famous for its detailed logs of system events leading to hardware and software failures. - HTTP CSIC 2010 Dataset
From the Spanish National Research Council (CSIC) containing a large collection of website traffic logs (HTTP requests) including a mix of thousands of normal, harmless and malicious (SQL injection, cross-site scripting, etc) requests. - ECML/PKDD 2007 Dataset
Is from a knowledge discovery competition held at the European Conference on Machine Learning & Principles and Practice of KNowledge Discovery in Databases)
A good place to start is LogHub which offers a sizable collection of system log datasets on https://github.com/logpai/loghub . The datasets are available in full as well as a shortened version of around 2,000 log file entries.
Other ways to create data sets are through
- Established Environments
For organisations who have an established cloud, edge or datacenter environment collecting metrics, logs and traces and use them as the train/test/validate dataset is another option. The advantage of this approach is that a changing environment’s data will expose model and capability drift as part of the test harness execution. - Chaos Engineering
Establishing data sets through the introduction of deliberate and known faults in established environments is a good way to train/test/validate the entire end to end system. Alternatively you can use existing demo applications such as the OTEL demo.
Performance Evaluation
Performance metrics for LLMs is a fairly nascent space, mostly because of the fact that more research goes into the models instead of model evaluation.
For AIOps, I propose that we simplify evaluation by disregarding the language model performance metrics such as cross entropy and perplexity, bits-per-character (BPC) and bits-per-byte (BPB) and focus on traditional metrics used for predictive AI such as spam/no-spam or anomaly/no-anomaly binary or low cardinality (a low number of unique values) use cases such as object detection and segmentation. Popular metrics in this space are Area Under the Curve (AUC) and the F1-score.
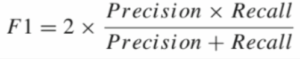
The reason the F1-score is useful is because it maintains a balance (harmonic mean) between Precision and Recall. Precision measures the proportion of true positive predictions over all positive predictions. Recall quantifies the proportion of true positives detected from all true positives (meaning also including the false negatives).
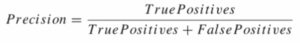
Precision answers the question: “Of all times the model predicted ‘Spam’ (True Positives + False Positives), how often was it correct (True Positives)?”

Recall answers the question: “Of all the actual spam emails that existed (=True Positives + False Negatives), how many did the model successfully catch (True Positives)?”
The harmonic mean is a type of average, which is strongly influenced by low numbers. It’s used because it emphasizes high accuracy and punishes low values, meaning only if both Precision and Recall are high the F1 score is high:
Depending on the type of AIOps capabilities under evaluation additional metrics to compare AIOps solutions against are:
- Mean-time-to-Detect (MTTD) for failure perception
- Mean-time-to-Repair (MTTR) for MTTD + RCA + Remediation steps generation
MTTD metrics are valid for the failure perception phase and for failure prediction.
MTTR is increasing in popularity for genAI/LLM based AIOps solutions to measure the entire end-to-end process from anomaly detection (including noise filtering and signal correlation) and root cause analysis (RCA), to the execution of remediation steps.
Because AIOps solutions have to perform well across different capabilities, it makes sense to not only evaluate against a single metric (e.g. F1 score) but also compare the individual phases of different solutions.
In Summary
We see a high number of possible permutations of new models, tooling, approaches and techniques – and the number is growing. In order to compare the performance and accuracy of different AIOps solutions on an ongoing basis we need to apply the same data set across the different permutations.
One of the first focus areas of the AIOps workstream under the Linux Foundation’s LFEdge umbrella is therefore the creation of a test harness. We consider this as a fundamental building block to know what approaches are improving results and which are not.